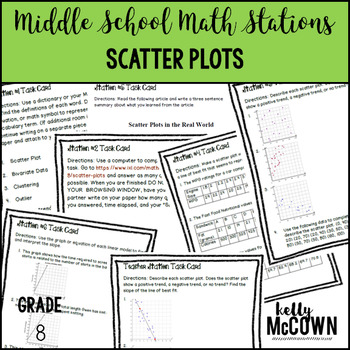
Today I posted a new Common Core Math Stations Activity on Teachers Pay Teachers titled "Scatter Plots". This math station activity is intended to help students understand how to construct and interpret scatter plots for bivariate measurement data to investigate patterns of association between two quantities. Describe patterns such as clustering, outliers, positive or negative association, linear association, and nonlinear association. Know that straight lines are widely used to model relationships between two quantitative variables. For scatter plots that suggest a linear association, informally fit a straight line, and informally assess the model fit by judging the closeness of the data points to the line.
Included are:
-6 different stations to engage students
-Teacher facilitated activity for 60-90 minutes of classroom time
-Stations include:
1. Vocabulary
2. Technology (Need classroom computers & internet access to ixl.com)
3. Practice of Scatter Plots
4. Additional Practice of Scatter Plots
5. Real World applications of Scatter Plots
6. Word problems of Scatter Plots
-Student Station Guide helps students record their answers
-ALL ANSWER KEYS included
View here: https://www.teacherspayteachers.com/Product/Math-Stations-Scatter-Plots-2377694
Visit my store for more activities: http://www.teacherspayteachers.com/Store/Kelly-Mccown
Happy Teaching!
~Kelly

No comments:
Post a Comment